There is a game researchers use to measure financial risk tolerance. It is called the trust game, and it works like this: you are given a sum of money and told you can send any portion of it to a stranger. Whatever you send will be tripled. The stranger then decides how much to return. There is no contract. No enforcement. No guarantee you will see any of it again.
How much you send reveals something about you — not just your trust in strangers, but your underlying relationship with risk and uncertainty. It is, in behavioral economics terms, one of the most elegant measurement instruments in the field. A single incentivized decision that cuts through self-report bias in a way that asking someone "how risk-tolerant are you?" never could.
I ran 2,058 of these trust game scores through every model I had. They beat every Big Five personality trait. Every cognitive measure. Every demographic variable. They ended up in the final predictive model alongside two variables you could look up in a phone book: age bracket and income bracket. That is the finding. And it is, I think, the most interesting result of the entire project.
The Setup
This past quarter in TBANLT 485 (Business Intelligence at UW Tacoma), I applied the full CRISP-DM data mining pipeline to the Twin-2K-500 dataset — a large-scale behavioral and psychometric survey of 2,058 participants across four research waves, with 500+ variables covering everything from Big Five personality scores to incentivized economic games to crystallized intelligence tests.
The business problem I framed: can a digital twin predict financial risk tolerance well enough to be useful in personalized financial services? Think robo-advisors, insurance pricing, behavioral nudge design. The target variable was score_riskaversion_recode — an implied risk aversion coefficient derived from real lottery choice experiments, not self-reported preference.
I built 18 predictors across four categories: Big Five personality (5 variables), cognitive ability (5), behavioral economics (4), and demographics (4). Then I ran every model the course framework allows — explanatory MLR, three flavors of stepwise regression, and a Bootstrap Forest. Six models total. The works.
What the Models Said
The explanatory MLR with all 18 predictors was statistically significant overall (F p=0.0007). Four variables reached individual significance at p < 0.05. Two were behavioral and demographic — the trust game score and age bracket. Two were cognitive — the Cognitive Reflection Test and income bracket.
Not a single Big Five personality trait.
That finding alone is worth sitting with. The Big Five is the dominant framework in personality psychology. Openness, conscientiousness, extraversion, agreeableness, neuroticism — these scales have been validated across decades of research and used in everything from hiring algorithms to clinical diagnosis. And in a model specifically designed to predict financial risk behavior, none of them cleared the significance threshold.
Then came the Bootstrap Forest result, which complicated things further. The forest ranked all five Big Five traits in the top eight variables by importance — Need for Cognition (8.0%), Neuroticism (7.8%), Extraversion (7.5%), Education Level (7.1%), Openness (6.9%). These scores dominated the variable importance rankings. And yet the forest's out-of-bag prediction error (RASE = 0.2950) was worse than the 3-variable linear model's validation RMSE (0.2271).
When stepwise regression ran forward and backward using BIC as the stopping criterion, both methods converged on the same three variables: trust game score, income bracket [$75k–$100k], and age bracket [18–29].
Model Results — Six Models, One Answer
- R² = 0.015Final 3-variable model explains 1.5% of variance in financial risk aversion
- RMSE = 0.2271Validation error on the stepwise linear model — better than the Bootstrap Forest's RASE of 0.2950
- 18 → 3Predictors entering the final model, from an initial candidate set of 18 across four categories
- 0 of 5Big Five personality traits reaching significance in the explanatory MLR (p < 0.05)
Why 1.5% Is the Finding, Not the Failure
There is a reflex in student data projects to treat low R² as something to explain away. To add more variables. To try a different model. To find the angle that makes the results look stronger than they are. I want to push back on that reflex, because I think it leads to worse analysis.
Three completely independent modeling approaches — explanatory regression, stepwise predictive regression, and a nonlinear ensemble method — all converged on the same answer: this dataset cannot predict financial risk aversion with deployment-ready accuracy. That convergence is informative. It is not a modeling artifact. It is a signal about the underlying data.
Adding nine more predictors (the Mixed stepwise run selected 12 variables) did not meaningfully improve RMSE and actually worsened BIC — the model complexity penalty went up while prediction barely moved. The signal in this dataset is real but small, and it is concentrated in a handful of behavioral and demographic variables, not the rich psychometric landscape the instrument was designed to map.
The honest conclusion: R² = 0.015 is what the data actually supports, and reporting it clearly is more valuable than any post-hoc massaging that might obscure it.
The Digital Twin Problem
The researchers who built the Twin-2K-500 instrument were trying to do something genuinely ambitious — create a behavioral digital twin of each participant. A rich enough multi-wave profile that you could model not just what people do, but who they are. The intuition behind that project is sound. The technology sector has been building digital twins for industrial systems for years — factory equipment, supply chains, climate models. The idea that you could do the same for human financial behavior is commercially compelling.
But there is a fundamental difference between an industrial digital twin and a human one. Industrial systems are deterministic within tolerances. A digital twin of a turbine can predict failure because the physical laws governing that turbine do not change based on what mood the turbine is in, whether it had a difficult childhood, or what it thinks about its own risk preferences.
Human behavioral data is irreducibly stochastic. And the Twin-2K-500 results suggest something more specific: the instruments we currently use to measure financial personality are not capturing the right signal. Self-reported personality scales — even validated, well-designed ones — are a layer of abstraction removed from actual financial behavior. The trust game score works precisely because it bypasses that abstraction. It measures what you actually do with real stakes, not what you think you would do in a hypothetical.
What a Better Instrument Would Look Like
If I were designing a study to predict financial risk tolerance with deployment-ready accuracy, I would build it around three principles that the Twin-2K-500, for structural reasons, could not fully implement.
| Principle | Current Approach | Better Alternative |
|---|---|---|
| Data Type | One-time psychometric surveys (Big Five, self-report scales) | Longitudinal behavioral data — investment choices, savings behavior, response to market volatility over time |
| Measurement Validity | Self-reported preferences ("how risk-tolerant are you?") | Incentivized measures throughout — instruments that put something at stake and record what people actually do |
| Feature Design | Demographic proxies (age, income bracket as stand-ins) | Domain-specific behavioral features that directly measure the underlying financial experience, not proxies for it |
The trust game result — a single incentivized behavioral measure outperforming all five Big Five personality scales combined — is pointing in this direction. The measurement direction is clear. The instrument needs to follow it.
The Dashboard
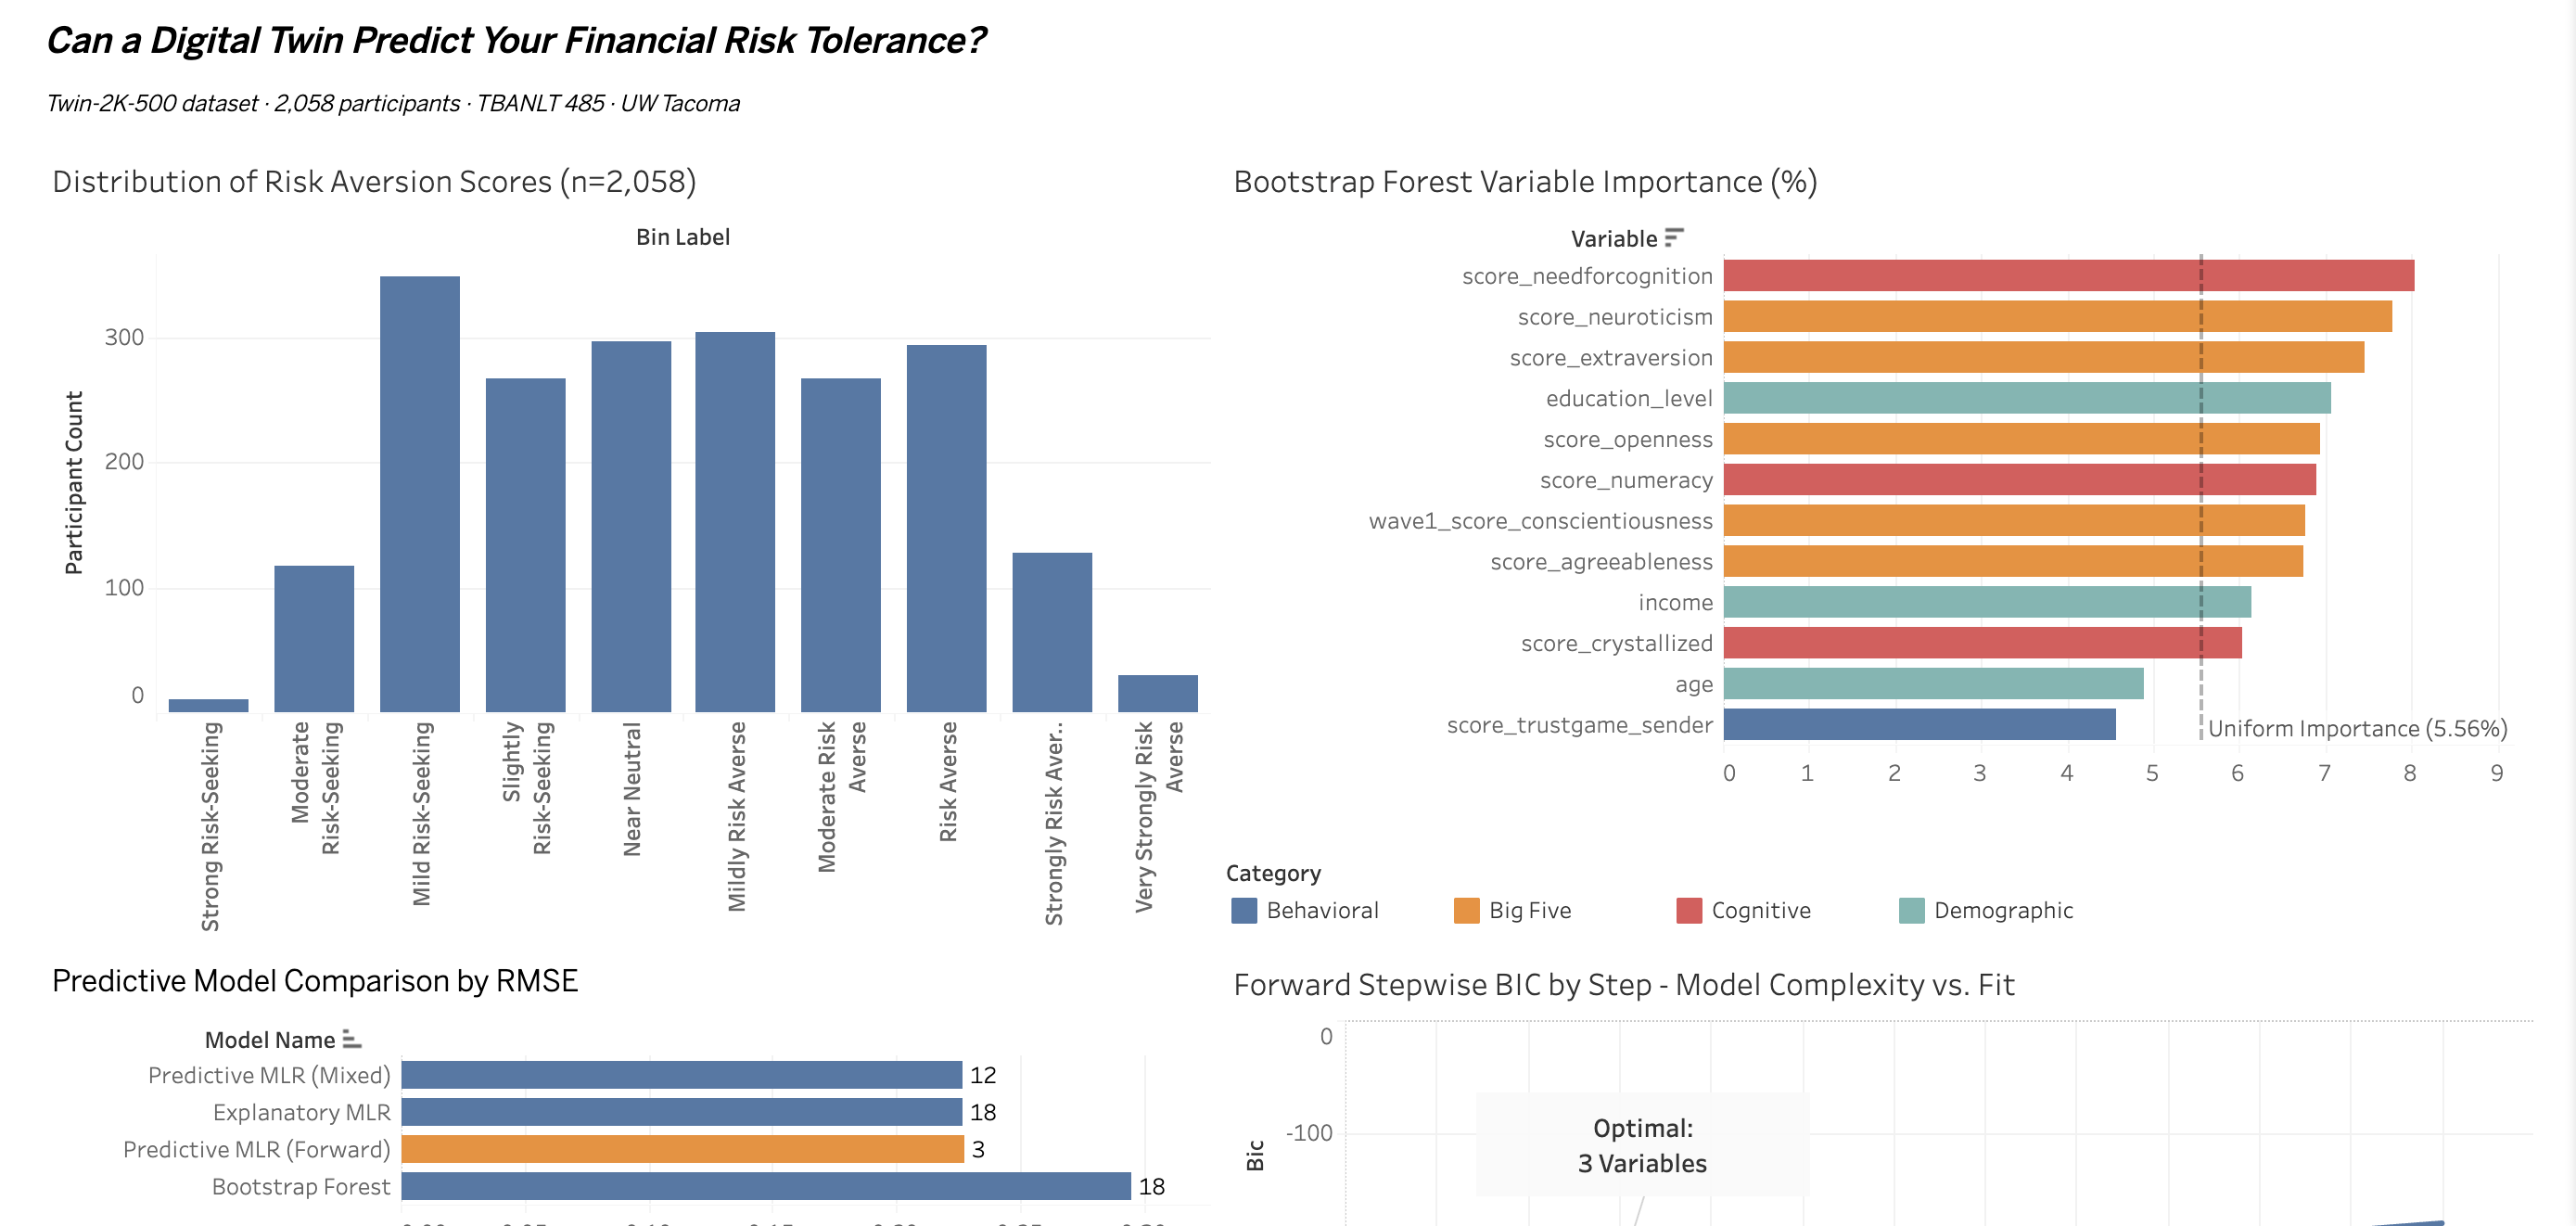
I built a four-panel Tableau dashboard to visualize the project findings: the risk aversion score distribution across all 2,058 participants, Bootstrap Forest variable importance rankings by category, the model comparison by RMSE, and the forward stepwise BIC curve showing exactly where complexity stops paying off.
The BIC curve is the one I find most visually compelling — you can see exactly where the 3-variable model sits at the minimum, and how quickly fit deteriorates as additional predictors are added. Parsimony wins, and the chart makes that argument without words. View the interactive dashboard on Tableau Public →
A Note on the Broader Landscape
This project sits at an interesting moment in the financial services industry's relationship with behavioral data. There is genuine commercial momentum behind the idea of using psychometric and behavioral signals to personalize financial products — robo-advisors are increasingly incorporating behavioral finance principles, insurance underwriters are experimenting with behavioral risk factors, and the fintech sector has produced a wave of startups promising to assess financial personality through everything from mobile phone usage patterns to social media behavior.
The Twin-2K-500 results are a useful calibration against some of that enthusiasm. The signal exists. Behavioral economic measures, demographic anchors, and cognitive measures do predict financial risk tolerance. But the current generation of psychometric instruments — even well-designed, rigorously validated ones — explains a fraction of the variance that would be required for commercial deployment. The gap between academic measurement and operational prediction is wider than the marketing materials for most fintech behavioral products would suggest.
That does not mean the project is wrong. It means the data needs to catch up to the ambition.